Step 1: Use search filter for searching.
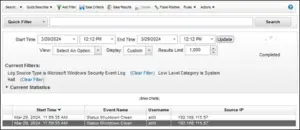
Here, we have search for system shutdown in windows server which IP is 192.168.115.57 and username atitt.
Step 2: Click save criteria to save above search result.
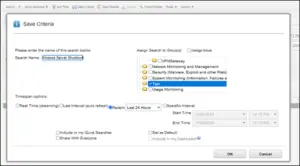
Here, we have included search name as Windows Server Shutdown and assign it to Test Group with certain timespan.
Note: The assign group should be use related to its search items.
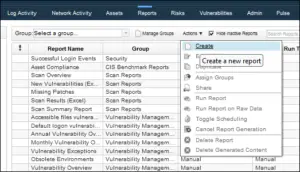
Step 3: Go to Report tab.
• Click action and select create.
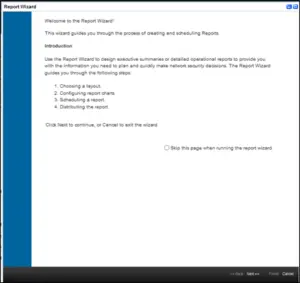
After selecting create report the below figure is displayed.
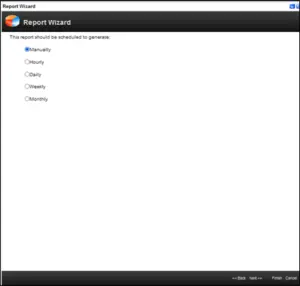
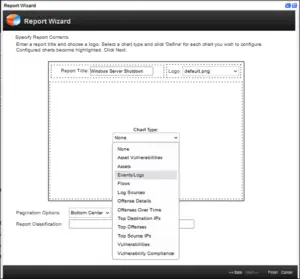
Step 4: Select scheduling report where user can select as per their requirement.
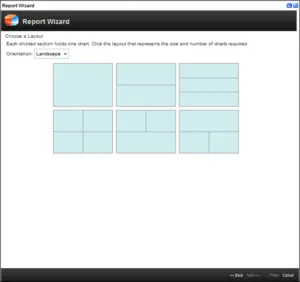
Step 5: Select layout where we have landscape and portrait. Here, user can also divide the section where each divided section holds one chart.
Step 6: Write report tittle as well as select logo and chart type. Here, we have use default logo but user can use customize logo.
To customize logo:
• In report tab, select branding where we can upload our own logo.
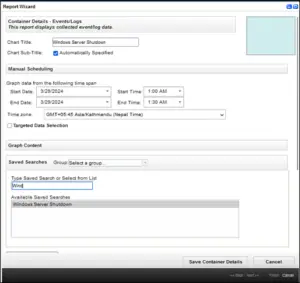
Step 7: Write chart tittle and schedule time manually.
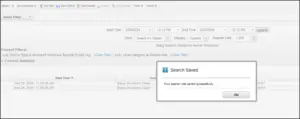
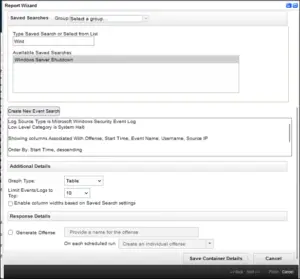
Step 8: Select available saved search which was created before (Step 2) and save container details.
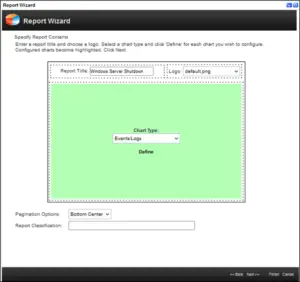
Step 9: After saving container the below figure is shown and then select next for another step.
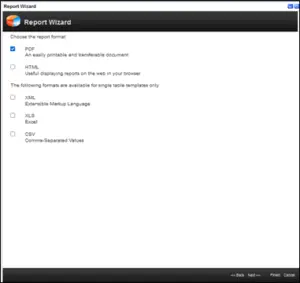
Step 10: Select the report format. It is recommended to select PDF.
• Select next
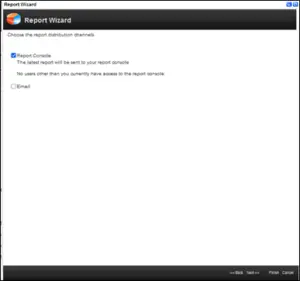
Step 11: Choose report distribution channels where report console helps to display report in our qradar console and the email option help to send report to the listed email user.
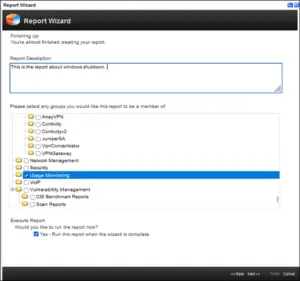
Step 12: Write report description and select group.
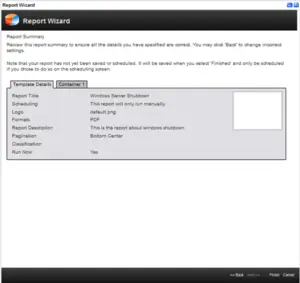
Step 13: Here, selects finish.
Step 14: Here, the report is being generated.
Step 15: After the report has been generated, select icon from formats to download it.
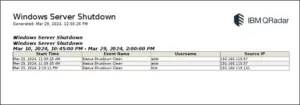
Step 16: The reports output.